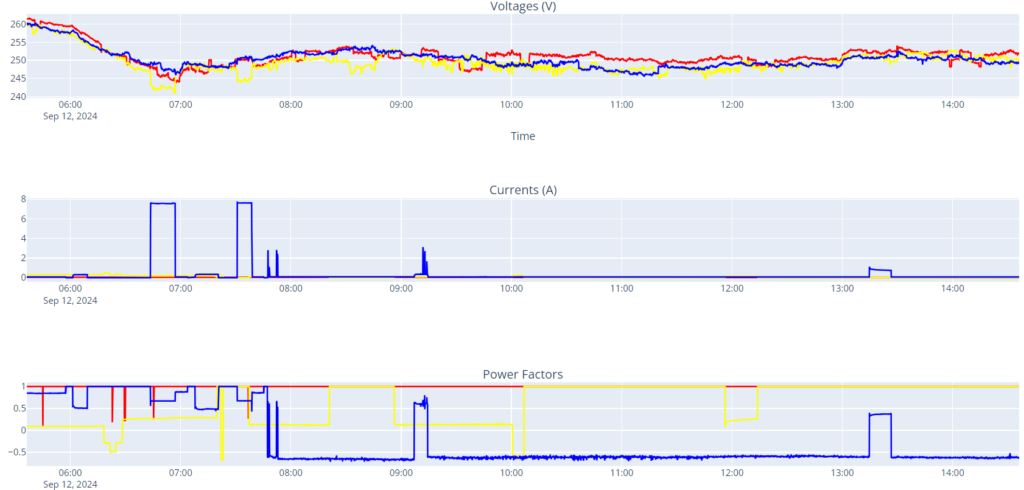
From the same home energy monitoring experiment data, attempting to identify patterns. This too is completely by Gen-AI. By the way now the data is being injected into a PostgreSQL database directly instead of a CSV file. I did this for better managing the volume of data. All this is on my laptop so not incurring any costs. Only cost so far is the AWS IoT Core usage. I would like to move that also to a LAN based MQTT broker to effectively make the costs to zero.

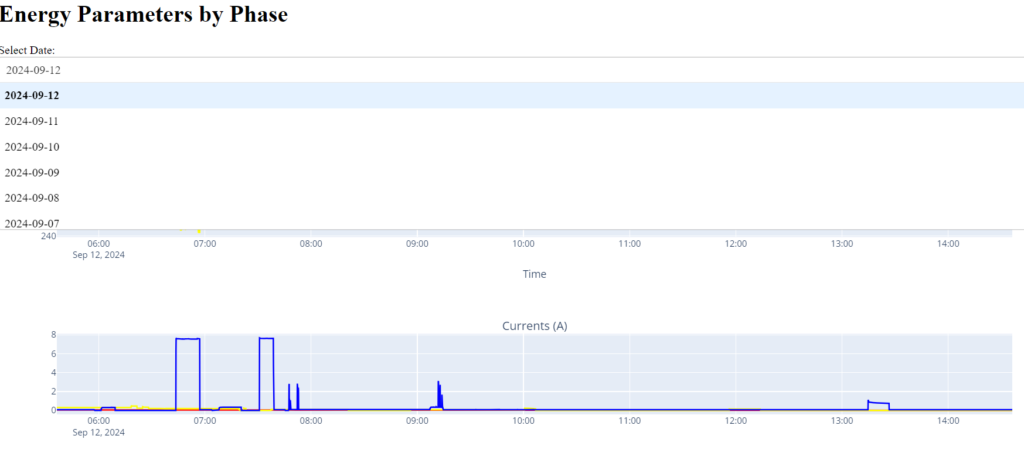
These plots are a little more advanced compared to the previous matplotlib plots. This uses Plotly and Dash to display the data in a webpage and also offers a drop-down list to select a desired date.

That was the first part of the task. After that I asked Gen-AI to implement a simple Neural Network to identify patterns within the voltage, current and power factors.
It automatically decided to use Keras which is a part of the TensorFlow library.
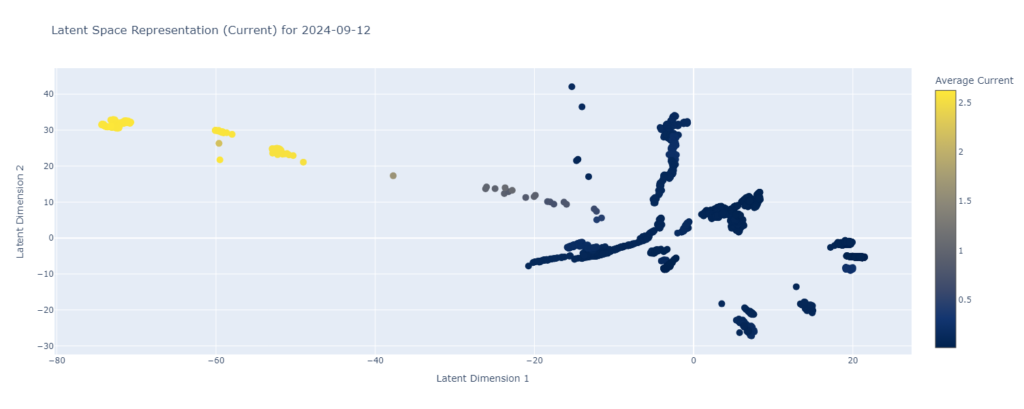
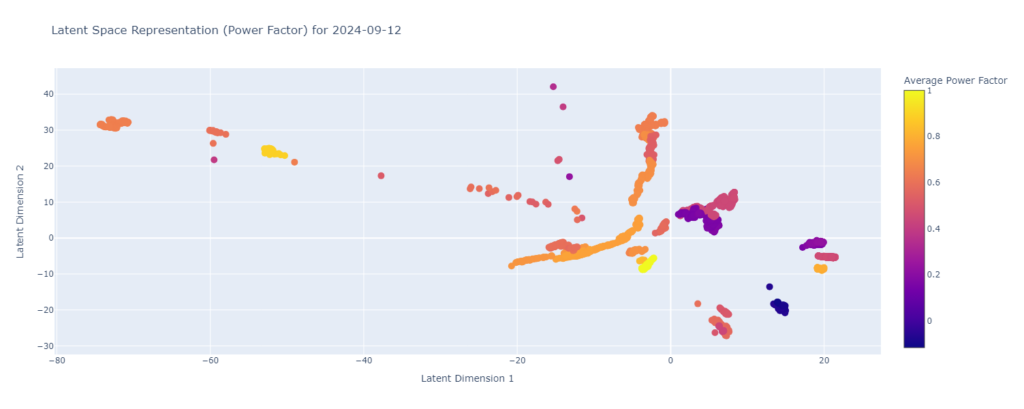
Using Keras and plotly functions it created “Latent Space Representations” of the Voltages, Currents and Power Factors.


I’ll further explore these representations to see if they are suitable. Objective is to learn a little about Artificial Intelligence and Machine Learning through iterative experimentation.
06th Oct’24

I also applied rolling window correlation method to look for patterns in correlation coefficient vs time plots. No significant insights were found that I could use for type of load detection.
If you’re reading this, do please share your comments below. Thank you!

Leave a Reply